Acid-base titration

Learning Objectives
At the end of this lecture, the student will be able to
• Explain the different types of acid-base titration
• Explain the theories of indicators
• Explain the different types of neutralization curves
• Discuss about the colour change and pH range of various acid base indicators
Acid-base titration
Acids
• Acids are sour tasting
• Blue litmus paper turns blue
• Arrhenius acid: Any substance that, when dissolved in water, increases the concentration of hydronium ion (H3O+)
• Bronsted Lowry acid: A proton donor
• Lewis acid: An electron acceptor
Base
• Bases are bitter tasting and slippery
• Red litmus turns to blue
• Arrhenius base: Any substance that, when dissolved in water, increases the concentration of hydroxide ion (OH-)
• Bronsted Lowery base: A proton acceptor
• Lewis acid: An electron donor
What Happens During Titration of Acid-Base Titration

Different types of acid-base titration:
• Acidimetry
• Alkalimetry
• Displacement titration
• Nonaqueous titration
Acidimetry: Titration of a base with a standard acid
Example: Sodium hydroxide with Hydrochloric acid
NaOH + HCl → NaCl+H2O
Alkalimetry: Titration of an acid with a standard based
Example: Hydrochloric acid with Sodium hydroxide
HCl+ NaOH → NaCl+H2O
Displacement titration: Titration which involves the displacement of a weaker anion and a cation by a stronger anion and cation
• They are of two types:
Titration of weaker anion by strong acid
Na2 B4O7 + H2SO4→ Na2SO4+ H3BO3
Titration of weaker cation with a strong base
NH4Cl+ NaOH→NH4OH+ NaCl
Non aqueous titration: Titration carried out in non-aqueous media for determining the strength of weak acid or weak base
• They are of two types: Acidimetry, Alkalimetry
Choosing a Titrant
In theory, any strong acid or strong base can be used as titrant
The reason for this is that most reaction involving a strong acid or a strong base is QUANTITATIVE
Strong base titrant | Weak base titrant | Strong acid titrant |
Sodium hydroxide, NaOH Potassium hydroxide, KOH Magnesium hydroxide,Mg(OH)2 Barium hydroxide, Ba(OH)2 | Ammonium hydroxide, NH4OH Amine acetate Carbonate, CO32- Flouride ion, F- Sodium carbonate, Na2CO3 | Hydrochloric acid, HCl Sulphuric acid, H2SO4 Perchloric acid, HClO4 |
pH – A Measure of Acidity
pH = -log [H+]
Solution |
| At 250C |
|
neutral | [H+] = [OH-] | [H+] = 1 x 10⁻⁷ | pH = 7 |
acidic | [H+] > [OH-] | [H+] > 1 x 10⁻⁷ | pH < 7 |
basic | [H+] < [OH-] | [H+] < 1 x 10⁻⁷ | pH > 7 |
Indicator and Choice of Indicator
Acid –Base Indicators
• The acid-base indicator function by changing colour just after the equivalence point of a titration; this colour change is called the end point
• The end point is most often detected VISUALLY. Most acid-base indicators are organic dye molecules which are either acids or bases.
• Indicators can be monoprotic (HIn) or diprotic (H2In) acids.
• The acid form of an indicator is usually coloured; when it loses a proton resulting in anion (In-), or base form of the indicator, exhibiting different colour
The two forms exist in equilibrium with one another as follows:
Hin ———————à H+ + In-
(colour A) (colour B)
A diprotic acid indicator, H2In, ionizes in TWO steps as follows:
H2In ———————à HIn- +
H+ ———————à H+ + In-
(colour A) (colourB) (colour C)
Selecting and Using Indicators
• Choose an indicator that undergoes a distinct colour change at the equivalence point (true end point) of an acid-base titration
• Choose an indicator whose middle half of the pH transition range (greatest colour change) encompasses/overlap the pH at the equivalence point or the pH at the steepest part of the titration curve.
• For indicator color change to be detectable by normal eyesight, a rough tenfold excess of one or the other form of the indicator must be present. This corresponds to a pH range of + 1 pH unit about the pK of the indicator
Acid-Base Indicators
Common Name | Transition range | Colour Change ACID | Colour Change BASE |
Crystal violet | 0.1 – 1.5 | Yellow | Blue |
Thymol blue | 1.2 – 2.8 | Red | Yellow |
Mrthyl yellow | 2.4 – 4.0 | Red | Yellow |
Methyl orange | 3.1 – 4.4 | Red | Yellow |
Bromocresol green | 3.8 – 5.4 | Yellow | Blue |
Methyl red | 4.2 – 6.3 | Red | Yellow |
Chlorophenyl red | 4.5 – 6.4 | Yellow | Red |
Bromothymol blue | 6.0 – 7.6 | Yellow | Blue |
Phenol red | 6.4 – 8.0 | Yellow | Red |
Thymol blue | 8.0 – 9.6 | Yellow | Blue |
Phenolpthalein | 8.0 – 9.7 | Colourless | Red |
Alizarin yellow | 10.0 – 12.0 | colourless | Violet |
Properties of an indicator:
Must have an easily observed colour change
Must change immediately in the required pH range over the addition of ‘half’ a drop of reagent

To be useful, an indicator must change over the “vertical” section of the curve where there is a large change in pH for the addition of a very small volume of alkali.
The indicator used depends on the pH changes around the end point – the indicator must change during the ‘vertical’ portion of the curve.
In the example, the only suitable indicator is PHENOLPHTHALEIN

Theory of indicator
• An acid/base indicator is a weak organic acid or a weak organic base whose undissociated form differs in colour from its conjugate base or conjugate acid form
Examples: Methyl orange, methyl red, —etc
Theory of indicator is explained based on:
Ostwald’s theory
Quinonoid theory
Based on Ostwald’s theory:
HIn + H2O ó In- + H3O+
or
In + H2O ó InH+ + OH-
• The behaviour of a base type indicator is described by the equilibrium
• The equilibrium constant takes the form:
[H3O+][In-] / [HIn] = Ka
Rearranging:
[H3O+] = Ka [HIn-]/[In-]
– HIn pure acid color: [HIn]/[In-] ≥ 10
– HIn pure base color: [HIn]/[In-] ≤ 0.1
~The ratios change from indicator to indicator~
– Substitute the ratios into the rearranged Ka: [H3O+] = 10Ka (acid color), [H3O+] = 0.1Ka (base color)
– pH range for indicator = pKa ± 1
• acid color pH = -log(10Ka) = pKa + 1
• base color pH = -log(0.1Ka) = pKa – 1
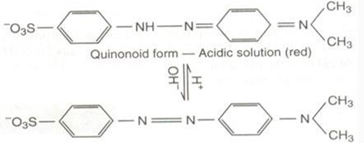
Quinonoid theory:
According to this theory
(a) The acid-base indicators exist in two tautomeric forms having different structures. Two forms are in equilibrium
One form is termed benzenoid form and the other quinonoid form.

(b) The two forms have different colors. The color change in due to the interconversation of one tautomeric form into other
(c) One form mainly exists in acidic medium and the other in alkaline medium
• Thus, during titration the medium changes from acidic to alkaline or vice-versa.
The change in pH converts one tautomeric form into other and thus, the colour change occurs.
Example for Phenolphthalein:
• Has benziod form in acidic medium and thus, it is colourless
• While it has quinonoid form in alkaline medium which has pink colour.
Methyl orange solution: has quinonoid form in acidic solution and benzenoid form in alkaline solution
The color of benzenoid form is yellow while that of quinoniod form is red
Mixed Indicators
• With ordinary acid base indicators, the color change is not sharp and abrupt, but it extends over 2 units of pH
• However, sometimes, it is desirable to have sharp color change over a narrow and selected range of pH
• This can be achieved by the use of mixture of indicators whose pKind values are close together and the overlapping colors are complementary at an intermediate pH value
For example:
A mixture of 3 parts of phenolphthalein and 1 part of naphtholphthalein shows a change in color from pale rose to violet at pH = 8.9. — Useful for the titration of phosphoric acid to diproti stage
Similarly, a mixture of 3 parts of thymol blue and 1 part of cresol red shows change in color from yellow to violet at pH = 8.3 — useful for the titration of CO32- to HCO3– stage
Neutralization Curve pH Curves
Types: There are four types of acid-base titration; each has a characteristic curve.
strong acid (HCl) v. strong base (NaOH)
weak acid (CH3COOH) v. strong alkali (NaOH)
strong acid (HCl) v. weak base (NH3)
weak acid (CH3COOH) v. weak base (NH3)
In the following examples, alkali (0.1M) is added to 25cm3 of acid (0.1M)
End points need not be “neutral‘ due to the phenomenon of salt hydrolysis
Strong Acid (HCl) v. Strong Base (NaOH)


Any of the indicators listed will be suitable – they all change in the ‘vertical’ portion
Strong Acid (HCl) v. Weak Base (NH3)
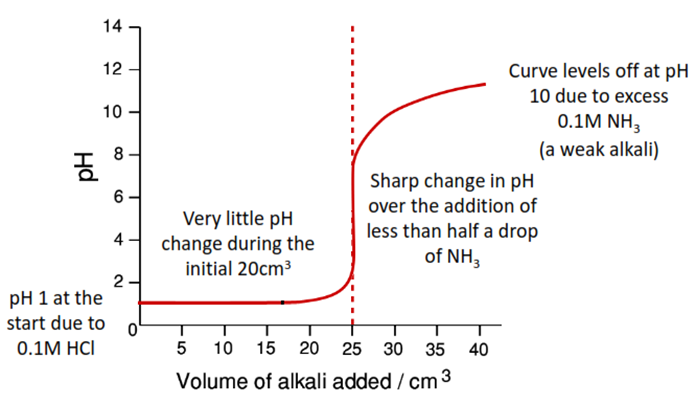

Only methyl orange is suitable – it is the only one to change in the ‘vertical’ portion
Weak Acid (CH3COOH) v. Strong Base (NaOH)


Only phenolphthalein is suitable – it is the only one to change in the ‘vertical’ portion
Weak Acid (CH3COOH) v. Weak Base (NH3)
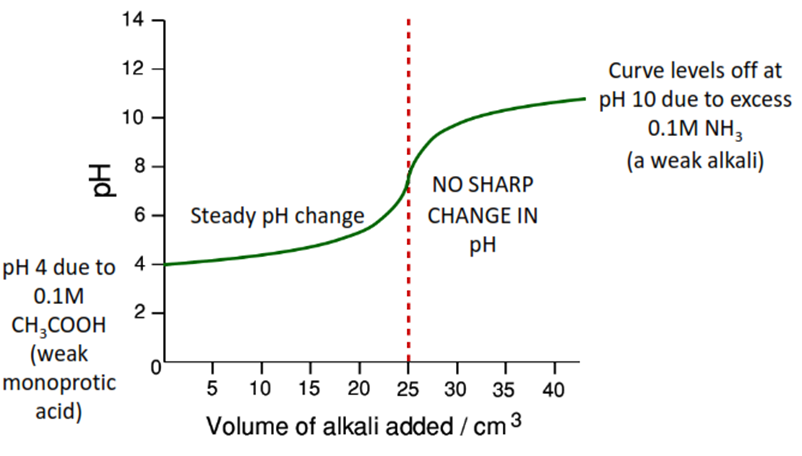

There is no suitable indicator- none change in the ‘vertical’ portion.
The end point can be detected by plotting a curve using a pH meter.
Other pH curves – Acid v. Carbonate
Sodium carbonate reacts with hydrochloric acid in two steps…
Step 1 Na2CO3 + HCl ——> NaHCO3 + NaCl
Step 2 NaHCO3 + HCl ——> NaCl + H2O + CO2
Overall
Na2CO3 + 2HCl ——> 2NaCl + H2O + CO2

There are two sharp pH changes
The second addition of HCl is exactly the same as the first because the number of moles of HCl which react with the NaHCO3 is the same as that reacting with the Na2CO3.
First rapid pH change around pH = 8.5 due to the formation of NaHCO3 Can be detected using phenolphthalein

Second rapid pH change around pH = 4 due to the formation of acidic CO2 Can be detected using methyl orange
Other pH curves- polyprotic acids (H3PO4)
Phosphoric acid is triprotic; it reacts with sodium hydroxide in three steps…
Step 1 H3PO4 + NaOH ——> NaH2PO4 + H2O
Step 2 NaH2PO4 + NaOH ——> Na2HPO4 + H2O
Step 3 Na2HPO4 + NaOH ——> Na3PO4 + H2O
There are three sharp pH changes
Each successive addition of NaOH is the same as equal number of moles are involved

Sodium Bi Carbonate
Assay Principle
Acid base, Acidic metric titration
NaHCO3 + H2SO4 ==> Na2SO4 + H2O + CO2
Indicator: Methyl orange
Colour change: yellow to Red
Boric acid
Assay Principle
Neutralization titration, indirect titration alkali metric
Indicator: phenolphthalein
Reagent: Glycerine
Colour change: colourless to pale pink
Summary acid-base titration
• Classification of acid-base titration:
Acidimetry
Alkalimetry
Displacement titration
Non aqueous titration
• Theory of indicators: Ostwalds theory, Quinonoid theory
• Neutralization Curves:
Strong acid vs strong base
Strong acid vs weak base
Strong base vs weak base
Weak acid vs weak base
• Indicators used for different types of acid base titrations
• Sodium bi carbonate: Acid base Acidic metric titration
• Boric acid: Neutralization titration, indirect titration alkali metric
Also, Visit: B. Pharmacy Notes | B. Pharma Notes | Study material Bachelor of Pharmacy